11 December 2024

Building trading bots is a very engaging hobby of mine & I find a lot of love in developing & testing different strategies via them!
From my journey in the world of automated trading, I’ve learned that the key to success lies in:
The platform has the goal of providing a seamless UI to interact with my core trading bot! I’ve created a very early MVP version of it and continue to work on the product!
You can add yourself to the Waitlist in order to receive updates and potentially FREE use of the platform! 💰
Waitlist & FREE MVP Version Available @ tradelikebot.com
Now, let’s dive into the specifics of the strategy we’ll be developing for this trading bot:
Objective: Identify optimal points for entering and exiting trades based on technical indicators that signal momentum shifts.
Indicators: We’ll use RSI for identifying overbought or oversold conditions and MACD to confirm the trend direction.

To pinpoint trading opportunities, we’ll focus on two main aspects:
Let’s get our hands dirty with some code. 👨💻
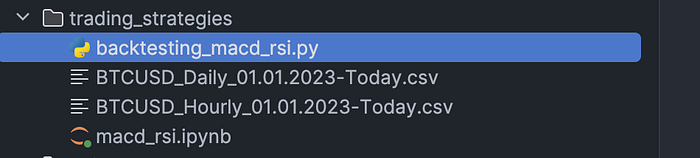
I am using Pycharm & Jupiter Notebook to run those bots. Jupiter allows me to run the code in cells which makes amazing developer experience as you can seprate each section into its own!
You can create Jupiter files in Pycharm like you do Python files 👀
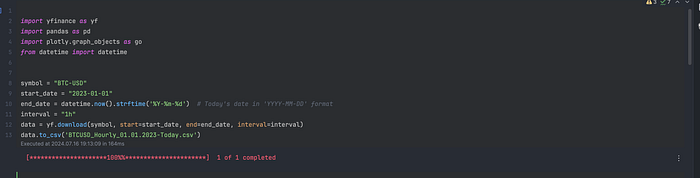
import yfinance as yf
import pandas as pd
import plotly.graph_objects as go
from datetime import datetime


symbol = "BTC-USD"
start_date = "2023-01-01"
end_date = datetime.now().strftime('%Y-%m-%d')  # Today's date in 'YYYY-MM-DD' format
interval = "1h"
data = yf.download(symbol, start=start_date, end=end_date, interval=interval)
data.to_csv('BTCUSD_Hourly_01.01.2023-Today.csv')
Here we define the crypto pair we wanna use the strategy on. We are choosing BTC-USD as it has the biggest liquidity & lowest volatility (compared to other crypto currencies/coins) in the crypto market!
We also define the start_date from which we wanna test our strategy. end_date is defined as today, as we want to test the strategy up until today!
Finally, we download the data and add it into a CSV file!
data.index = pd.to_datetime(data.index)
data.dropna(inplace=True)
☝️ In the above snippet we ensure that the index is in the datetime format, follwed by cleaning up of all rows with Nan values.
# Calculate Exponential Moving Average for MACD
exp1 = data['Close'].ewm(span=12, adjust=False).mean()
exp2 = data['Close'].ewm(span=26, adjust=False).mean()
data['MACD'] = exp1 - exp2
data['MACDs'] = data['MACD'].ewm(span=9, adjust=False).mean()

# Calculate RSI
delta = data['Close'].diff()
gain = (delta.where(delta > 0, 0)).ewm(span=14, adjust=False).mean()
loss = (-delta.where(delta < 0, 0)).ewm(span=14, adjust=False).mean()
rs = gain / loss
data['RSI'] = 100 - (100 / (1 + rs))
Here, we calculate the actual indicators in order to use them to trigger the BUY & SELL signals for our strategy! 📊
We use the ewm , which is helping us use the Exponential Moving Window and calculate the exponential moving averages & the gain or loss from the signals!
def determine_signal(row):
    if row['RSI'] > 70 and row['MACD'] < row['MACDs']:
        return -1  # Sell
    elif row['RSI'] < 30 and row['MACD'] > row['MACDs']:
        return 1   # Buy
    return 0

data['Signal'] = data.apply(determine_signal, axis=1)

print("Buy signals count:", data[data['Signal'] == 1].shape[0])
print("Sell signals count:", data[data['Signal'] == -1].shape[0])
A function that takes the row , which gives us the configured financial data (indicator prices at the given time) & triggers Buy or Sell signals based on the rules we specified earlier.
We add a column called Signal that has the value -1, 0, 1 based on the triggered signal.
Finally we print out the number or triggered Buy & Sell signals for monitoring and debugging purposes!
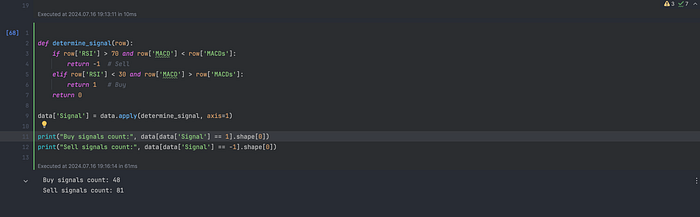
fig = go.Figure(data=[
go.Candlestick(x=data.index,
open=data['Open'], high=data['High'],
low=data['Low'], close=data['Close']),
go.Scatter(x=data.index, y=data['RSI'], name='RSI',
line=dict(color='blue', width=2)),
go.Scatter(x=data.index, y=data['MACD'], name='MACD',
line=dict(color='red', width=2)),
go.Scatter(x=data.index, y=data['MACDs'], name='Signal line',
line=dict(color='green', width=2)),
go.Scatter(x=data.index[data['Signal'] == 1], y=data['Low'][data['Signal'] == 1] * 0.99,
mode='markers', name='Buy Signal', marker=dict(symbol='triangle-up', size=10, color='blue')),
go.Scatter(x=data.index[data['Signal'] == -1], y=data['High'][data['Signal'] == -1] * 1.01,
mode='markers', name='Sell Signal', marker=dict(symbol='triangle-down', size=10, color='yellow'))
])
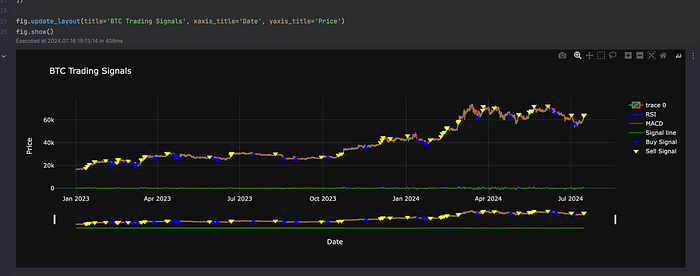
fig.update_layout(title='BTC Trading Signals', xaxis_title='Date', yaxis_title='Price')
fig.show()Finally, lets add the above lines to vizualize the signals on a beautifully generated chart! 🤩 👇
With the strategy and signals defined, you’ll want to backtest using historical data to validate the effectiveness before going live.
For that, you can leverage various tools and Python libraries, but for now I will create a separate Python file that runs the strategy and outputs the results of each trade!
I will add all code in a GitHub repo. There you’ll find the backtesting file as well! Don’t wanna add it here as the Medium post will get lengthy.. ✌️
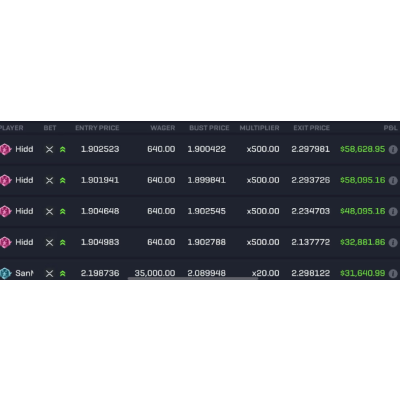
That said, here is the result of the backtest 📈:
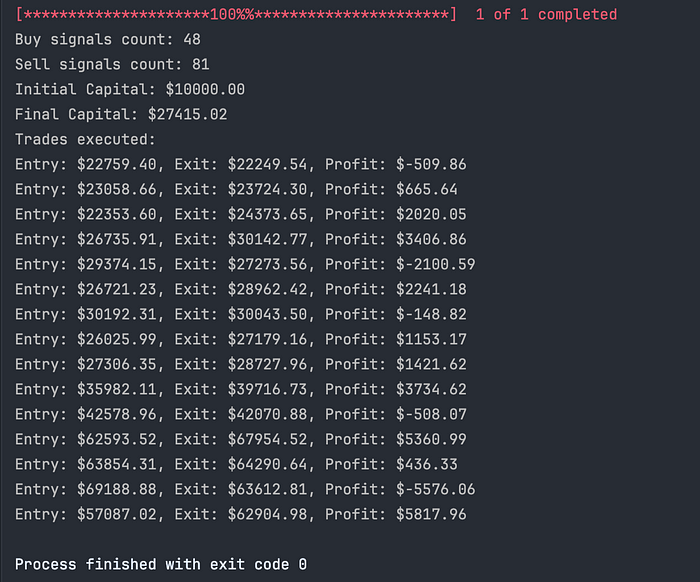
You ca see we’ve made some losing trades, but when you cross final line, you get far bigger profits over the long-term. An example of why you should TRUST THE PROCESS & YOUR STRATEGY! 👊


 BTC
BTC ETH
ETH USDT
USDT USDC
USDC TRX
TRX